• Skip to main content
  • Skip to secondary menu
  • Skip to footer

Market Research Media

taking uncertainty out of decision making

  • Sponsored Post
  • Domain Marketplace
  • Publications
    • Software Projects
  • Technology Desk
  • About
    • How to Conduct Market Research, a Practical Step-by-Step Guide
    • Methodology, How Market Research Media Works With Numbers
    • Why Is Market Research Important, Seven Decisions It Changes
    • How to Conduct Media Market Research, Audiences, Ratings and Ad Spend
    • How to Conduct Social Media Research, Listening, Sampling and the Limits of Platform Data
    • How to Conduct a Market Research Survey, From Sample Size to Question Wording
  • Contact

Survey Margin of Error Explained, What Plus or Minus 3 Points Covers and What It Leaves Out

October 28, 2026

Almost every survey headline comes with a small line underneath. Margin of error, plus or minus 3 percentage points. Readers take it as a measure of how accurate the survey is. It isn’t, or not quite. It measures one specific kind of error, and often not the largest one.

The margin of error describes sampling error. If you draw a random sample of people from a population, you won’t get exactly the same answer as if you’d asked everyone. Draw another random sample and you’d get a slightly different result again. The margin of error says how far a result is likely to wander from the true population value because of that luck of the draw alone, usually at a 95% confidence level. Roughly, if you ran the same survey many times, about 95 out of 100 results would fall within that range of the true figure.

Where the 3 points come from

For a simple random sample, the margin depends mainly on sample size, not on the size of the population. That surprises people. A well-drawn sample of about 1,000 gives a margin of roughly plus or minus 3 points whether the population is a city or a whole country. About 400 respondents gives roughly plus or minus 5. To halve the margin, you need about four times the sample, which is why most national polls stop around 1,000 to 1,500 people.

The margin is largest when the answer is near 50%, and smaller near the extremes. A result of 10% from 1,000 people carries a margin closer to 2 points than 3. Published figures usually quote the worst case.
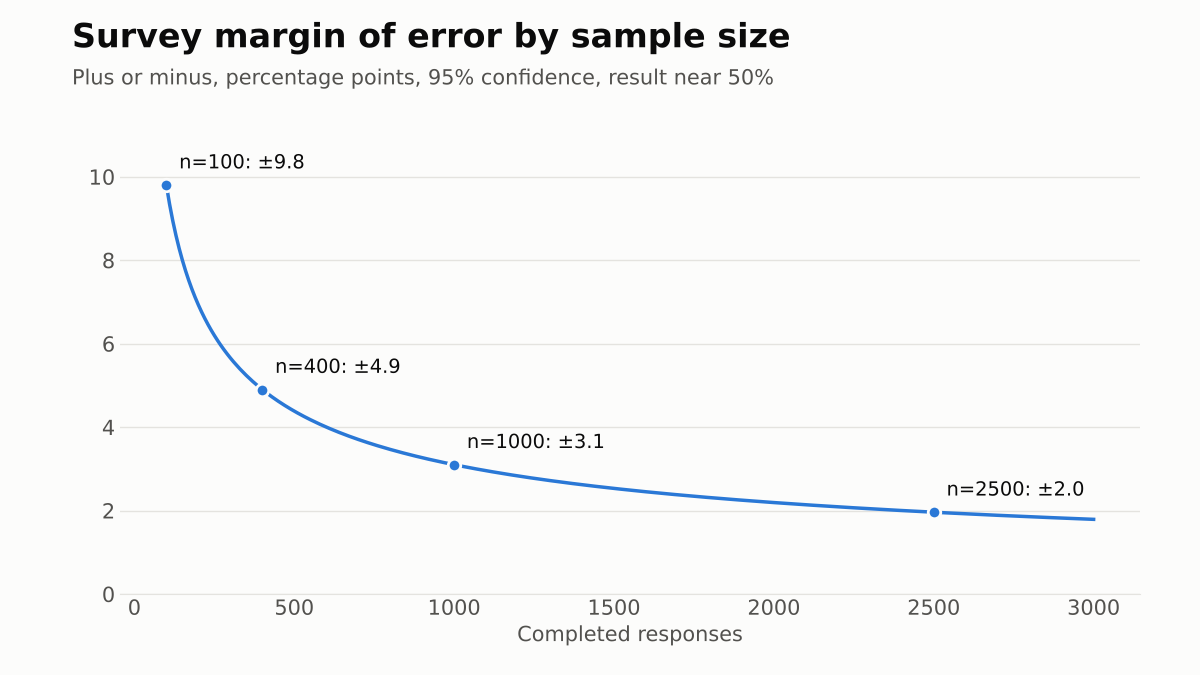
Survey margin of error by sample size at 95 percent confidence

Two traps follow. First, the margin applies to each number, not to the gap between them. If a survey shows brand A at 46% and brand B at 42%, with plus or minus 3 points each, the lead of 4 points isn’t clearly outside the noise. The margin on the difference between two figures from the same sample is larger, close to double in a tight two-way split. Second, subgroups have their own, bigger margins. The 18 to 24 year olds in a sample of 1,000 might be 120 people, and their figure could carry a margin of 9 points or more.

What the margin doesn’t cover

The formula assumes a true random sample in which everyone in the population had a known chance of being picked, and everyone picked answered. Real surveys don’t work that way, and the gaps cause errors the margin knows nothing about.

Coverage error. If the sampling frame misses part of the population, people without landlines, people who never join online panels, people who don’t speak the survey’s language, the result describes the people who could be reached, not everyone.

Nonresponse error. Response rates for phone polls have fallen into single digits in many markets. If the people who answer differ from those who don’t in ways that matter to the question, weighting can only partly fix it.

Measurement error. Question wording, order and the answer options shape the result. Ask whether people “support” a policy and you’ll get a different figure than if you ask whether they “oppose” it, or offer a “don’t know” option.

Opt-in panels. Many market research and online surveys use volunteer panels, not random samples. For those, a classical margin of error doesn’t strictly apply. Good researchers publish a “credibility interval” or a modelled error estimate instead and explain how they weighted the sample.

How to read a survey number

Check the sample size and how people were recruited before the margin. Look for the field dates, the exact question wording and the weighting variables. Treat small subgroup figures with suspicion. And when two numbers sit within a few points of each other, read the result as close, not as a winner and a loser. The plus or minus line is a floor on the uncertainty, not a ceiling.

Filed Under: Methods Tagged With: market research, statistics, survey methodology

Footer

Recent Posts

  • Social Media and News in 2026, Platforms Gain Reach as Publishers Lose Direct Contact
  • Digital Museums in 2026, Online Collections Grow While Visitors Still Want the Originals
  • Music Trends for Content Creators in 2026, Licensing Matters More Than Viral Sounds
  • Federated Social Media in 2026, Why ActivityPub and Bluesky Are Taking Different Routes
  • What Worries the World in 2026, Inflation Back on Top as Crime and Jobs Follow and Climate Slips
  • Digital Camera Shipments in 2026, Why the 2025 Recovery Has Lost Momentum
  • Disney Public Domain Adaptations in 2026, Why Classic Stories Are No Guarantee of a Hit
  • AI and Hollywood Screenwriters in 2026, What the New WGA Contract Says About Generative AI
  • News Video Commentary in 2026, Why Creators Lead Discovery and Publishers Keep the Facts
  • Media Sentiment Measurement in 2026, Why AI Scores Still Need Human Review

RSS feed: Market Analysis Market Analysis

  • AI Powered Coding Could Shift Desktop Market Share From Windows to Linux
  • Pure Lithium Turned Down a 51% US Government Stake, an Analysis of Washington’s 40-Company Equity Portfolio
  • Anthropic Shares Rise 21% on IPO Debut, but the Wider AI Market Sends a Different Signal
  • Quad9 France Exit Turns DNS Blocking Into an Infrastructure Market Risk
  • Robot Market Fight Heats Up as US Orders Jump 25% and Chinese Humanoid Makers Lose CES Visas
  • Anthropic (ANT) Prices at 83 Dollars and Wall Street Wraps It in 2x ETFs and CFDs Within Days as Cantor Explains Its Nvidia Hedges
  • Hormuz Risk Gauge Falls to 63.8 High as the Dubai Premium Vanishes While Tanker Attacks Keep Coming
  • China Turns AI Model Distillation Into Industrial Policy and Weakens the Reach of US Chip Controls
  • AI-Found Software Flaws and the Rush to Patch Them Are Now a Market Risk After a Week of US Outages
  • Ohio Voters Put $17 Billion of Amazon Data Center Spending at Risk as Local Bans Spread

Media Partners

  • Analysis
  • Technology Conferences
  • OSINT
  • Defense Market
  • Cybersecurity Market
  • Event Calendar
  • Calendarial
  • Opinion
  • 3V
  • Media Presser
  • Exclusive Domains

Copyright © 2026 Market Research Media | Terms of Service | Privacy Policy | Supplier Disclaimer | The Website Coded and Designed by SoftDev Studio

Media Partners: Technologies | Photography | Referently

We use cookies on our website to give you the most relevant experience by remembering your preferences and repeat visits. By clicking “Accept”, you consent to the use of ALL the cookies.
Do not sell my personal information.
Cookie SettingsAccept
Manage consent

Privacy Overview

This website uses cookies to improve your experience while you navigate through the website. Out of these, the cookies that are categorized as necessary are stored on your browser as they are essential for the working of basic functionalities of the website. We also use third-party cookies that help us analyze and understand how you use this website. These cookies will be stored in your browser only with your consent. You also have the option to opt-out of these cookies. But opting out of some of these cookies may affect your browsing experience.
Necessary
Always Enabled
Necessary cookies are absolutely essential for the website to function properly. These cookies ensure basic functionalities and security features of the website, anonymously.
CookieDurationDescription
cookielawinfo-checkbox-analytics11 monthsThis cookie is set by GDPR Cookie Consent plugin. The cookie is used to store the user consent for the cookies in the category "Analytics".
cookielawinfo-checkbox-functional11 monthsThe cookie is set by GDPR cookie consent to record the user consent for the cookies in the category "Functional".
cookielawinfo-checkbox-necessary11 monthsThis cookie is set by GDPR Cookie Consent plugin. The cookies is used to store the user consent for the cookies in the category "Necessary".
cookielawinfo-checkbox-others11 monthsThis cookie is set by GDPR Cookie Consent plugin. The cookie is used to store the user consent for the cookies in the category "Other.
cookielawinfo-checkbox-performance11 monthsThis cookie is set by GDPR Cookie Consent plugin. The cookie is used to store the user consent for the cookies in the category "Performance".
viewed_cookie_policy11 monthsThe cookie is set by the GDPR Cookie Consent plugin and is used to store whether or not user has consented to the use of cookies. It does not store any personal data.
Functional
Functional cookies help to perform certain functionalities like sharing the content of the website on social media platforms, collect feedbacks, and other third-party features.
Performance
Performance cookies are used to understand and analyze the key performance indexes of the website which helps in delivering a better user experience for the visitors.
Analytics
Analytical cookies are used to understand how visitors interact with the website. These cookies help provide information on metrics the number of visitors, bounce rate, traffic source, etc.
Advertisement
Advertisement cookies are used to provide visitors with relevant ads and marketing campaigns. These cookies track visitors across websites and collect information to provide customized ads.
Others
Other uncategorized cookies are those that are being analyzed and have not been classified into a category as yet.
SAVE & ACCEPT